

Data Interpretation Questions play an important role in all the competitive exams, so we are providing here the most expected Data Interpretation Set Which will help you to boost your Data Interpretation skills. All the aspirants who are preparing for bank examinations or other competitive examinations can take benefits from this set.
Directions (1 – 5): Study the following information carefully and answer the questions give below:
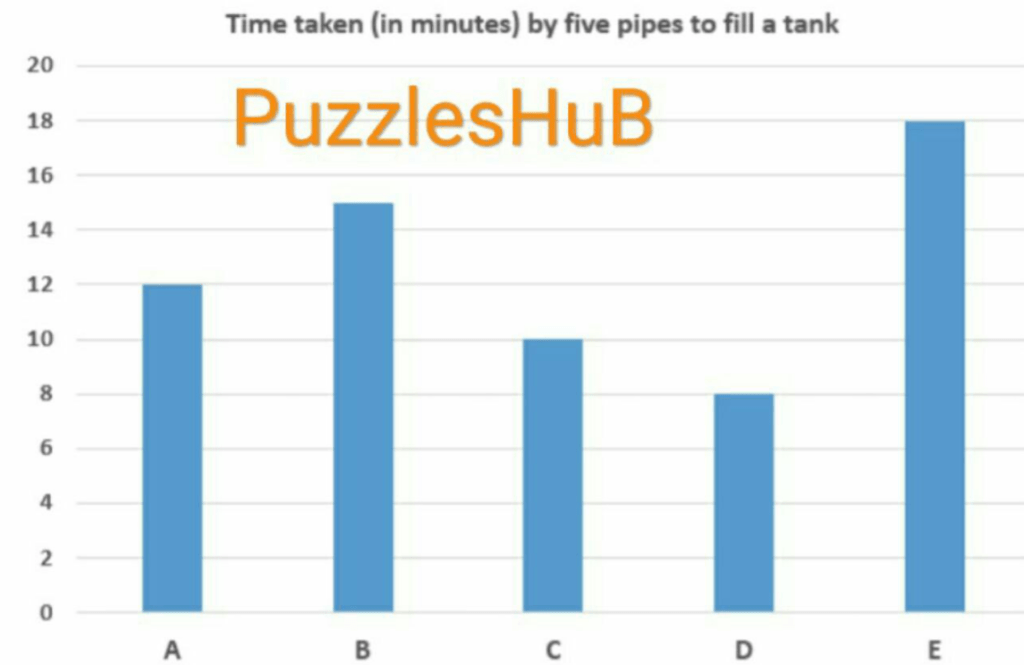
The bar graph 1 shows the time taken by five pipes (A, B, C, D and E) to fill a tank
The bar graph 2 shows the time taken by five pipes (P, Q, R, S and T) to empty the tank

The following table shows the ratio of time taken by pipes to fill the tank.

0 of 5 questions completed Questions:
Click The Start Quiz Button!
You have already completed the quiz before. Hence you can not start it again.
Quiz is loading...
You must sign in or sign up to start the quiz.
You have to finish following quiz, to start this quiz:
0 of 5 questions answered correctly
Your time:
Time has elapsed
You have reached 0 of 0 points, (0) Pipe A and Pipe B opened simultaneously for 4 minutes, then closed and then pipe F and pipe Q are opened for 2 minutes, and then closed. Find the time taken by pipe G to fill the remaining part of the tank. Part of the tank filled by pipe A in one minute = 1/12 Part of the tank filled by pipe A in one minute = 1/12 Efficiency of pipe K is twice the efficiency of pipe A and efficiency of pipe L is 1.5 times the efficiency of pipe S. Pipe C and pipe K are opened simultaneously for 3 minutes and then closed. Find the time taken by pipe L and pipe R together to empty the filled part of the tank. Part of the tank filled by pipe A in one minute = 1/12 Part of the tank filled by pipe A in one minute = 1/12 Time taken by pipe M to fill the tank is 20% more than the time taken by pipe I to fill the tank and efficiency of pipe N is twice the efficiency of pipe J. Time taken by pipe M and pipe N to fill the tank is what percent of the time taken by pipe D and pipe E together to fill the tank. Time taken by pipe I to fill the tank = 5/4 x 8 = 10 minutes Time taken by pipe I to fill the tank = 5/4 x 8 = 10 minutes Find the respective ratio of time taken by pipe B, pipe G and pipe P together to fill the tank to that of time taken by pipe E, pipe H and pipe S together to fill the tank. Part of the tank filled by pipe B in one minute = 1/15 Part of the tank filled by pipe B in one minute = 1/15 Pipe A, pipe C and pipe E are opened simultaneously for 4 minutes then closed and pipe P and pipe S are opened for 2 minutes then closed. Find the time taken by pipe G and pipe J to fill the remaining part of the tank. Part of the tank filled by pipe A in one minute = 1/12 Part of the tank filled by pipe A in one minute = 1/12Quiz-summary
Information
Results
Average score
Your score
Categories
Pos.
Name
Entered on
Points
Result
Table is loading
No data available
1. Question
Part of the tank filled by pipe B in one minute = 1/15
Time taken by pipe F to fill the tank = 4/3 x 12 = 16 minutes
Part of the tank filled by pipe F in one minute = 1/16
Time taken by pipe G to fill the tank = 2/3 x 15 = 10 minutes
Part of the tank filled by pipe G in one minute = 1/10
Part of the tank emptied by pipe Q in one minute = 1/18
Let required time = t minutes
According to the question
4/15 + 4/12 + 2/16 – 2/18 + t/10 = 1
=> t/10 = 1 – 4/15 – 1/3 – 1/8 + 1/9
=> t/10 = (360 – 120 – 90 – 45 + 40)/360
=> t/10 = 139/360
=> t = 139/360 x 10
=> t = 139/36 minutes
2. Question
Part of the tank filled by pipe K in one minute = 2/12 = 1/6
Part of the tank filled by pipe C in one minute = 1/10
Part of the tank emptied by pipe S in one minute = 1/24
Part of the tank emptied by pipe L in one minute = 1.5/24 = 1/16
Part of the tank emptied by pipe R in one minute = 1/16
Part of the tank filled by pipe C and pipe K in 3 minutes = 3/10 + 3/6
= (9 + 15)/30
= 24/30
Let the required time taken = t minutes
t/16 + t/16 = 24/30
=> 2t/16 = 24/30
=> t = 24/30 x 16/2
=> t = 32/5 minutes
3. Question
Part of the tank filled by pipe I in one minute = 1/10
Time taken by pipe M to fill the tank = 10 x 120/100 = 12 minutes
Part of the tank filled by pipe M in one minute = 1/12
Time taken by pipe J to fill the tank = 10/9 x 18 = 20 minutes
Part of the tank filled by pipe J in one minute = 1/20
Part of the tank filled by pipe N in one minute = 2/20 = 1/10
Part of the tank filled by pipe D in one minute = 1/8
Part of the tank filled by pipe E in one minute = 1/18
Let the time taken by pipe M and pipe N to fill the tank = t minutes
And the time taken by pipe D and pipe E to fill the tank = k minutes
t/12 + t/10 = 1
=> (5t + 6t)/60 = 1
=> 11t/60 = 1
=> t = 60/11 minutes
And
k/8 + k/18 = 1
(9k + 4k)/72 = 1
=> k = 72/13 minutes
Required percentage = (60/11)/(72/13) x 100
= 60/11 x 13/72 x 100
= 98.48%
4. Question
Time taken by pipe G to fill the tank = 2/3 x 15 = 10 minutes
Part of the tank filled by pipe G in one minute = 1/10
Part of the tank emptied by pipe P in one minute = 1/20
Part of the tank filled by pipe E in one minute = 1/18
Time taken by pipe H to fill the tank = 6/5 x 10 = 12 minutes
Part of the tank filled by pipe H in one minute = 1/12
Part of the tank emptied by pipe S in one minute = 1/24
Let the time taken by pipe B, pipe g and pipe P together to fill the tank = t minutes
And the time taken by pipe E, pipe H and pipe S together to fill the tank = k minutes
t/15 + t/10 – t/20 = 1
=> (4t + 6t – 3t)/60 = 1
=> 7t/60 = 1
=> t = 60/7 minutes
And
k/18 + k/12 – k/24 = 1
=> (4k + 6k – 3k)/72 = 1
=> 7k/72 = 1
=> k = 72/7 minutes
Required ratio = 60/7: 72/7 = 5:6
5. Question
Part of the tank filled by pipe C in one minute = 1/10
Part of the tank filled by pipe E in one minute = 1/18
Part of the tank emptied by pipe P in one minute = 1/20
Part of the tank emptied by pipe S in one minute = 1/24
Time taken by pipe G to fill the tank = 2/3 x 15 = 10 minutes
Part of the tank filled by pipe G in one minute = 1/10
Time taken by pipe J to fill the tank = 10/9 x 18 = 20 minutes
Part of the tank filled by pipe J in one minute = 1/20
Let the required time taken = t minutes
4/12 + 4/10 + 4/18 – 2/20 – 2/24 + t/10 + t/20 = 1
=>1/3 + 2/5 + 2/9 – 1/10 – 1/12 + (2t + t)/20 = 1
=> (60 + 72 + 40 – 18 – 15)/180 + 3t/20 = 1
=> 139/180 + 3t/20 = 1
=> 3t/20 = 1 – 139/180
=> 3t/20 = (180 – 139)/180
=> 3t/20 = 41/180
=> t = 41/180 x 20/3
=> t = 41/27 days

Hello Friends, I am from India. After earning my Graduate degree in Computer Application, I decided to pursue my passion for Web Designing and Content Writing. My ultimate goal is to become one of the best in my field and continue to deliver high-quality content. Further, I aim to deliver the latest information regarding recruitment to job seekers, the latest news with accuracy, which shall benefit them in every way possible.
Related Posts
- Data Interpretation Set ~ 4 (Mains Level)
Data Interpretation Questions play an important role in all the competitive exams, so we are…
- Data Interpretation Set ~ 5 (Mains Level)
Data Interpretation Questions play an important role in all the competitive exams, so we are…
- Data Interpretation Set ~ 6 (Mains Level)
Data Interpretation Questions play an important role in all the competitive exams, so we are…
- Data Interpretation Set ~ 8 (Mains Level)
Data Interpretation Questions play an important role in all the competitive exams, so we are…
- Data Interpretation Set ~ 3 (Mains Level)
Data Interpretation Questions play an important role in all the competitive exams, so we are…
- Data Interpretation Set ~ 7 (Mains Level)
Data Interpretation Questions play an important role in all the competitive exams, so we are…
- Data Interpretation Set ~ 8 (Pre Level)
Data Interpretation Questions play an important role in all the competitive exams, so we are…
- Data Interpretation Set ~ 9 (Pre Level)
Data Interpretation Questions play an important role in all the competitive exams, so we are…
- Data Interpretation Set ~ 7 (Pre Level)
Data Interpretation Questions play an important role in all the competitive exams, so we are…
- Data Interpretation Set ~ 4 (Mains Level)
Data Interpretation Questions play an important role in all the competitive exams, so we are…